Skip to content

Built To Be Used.

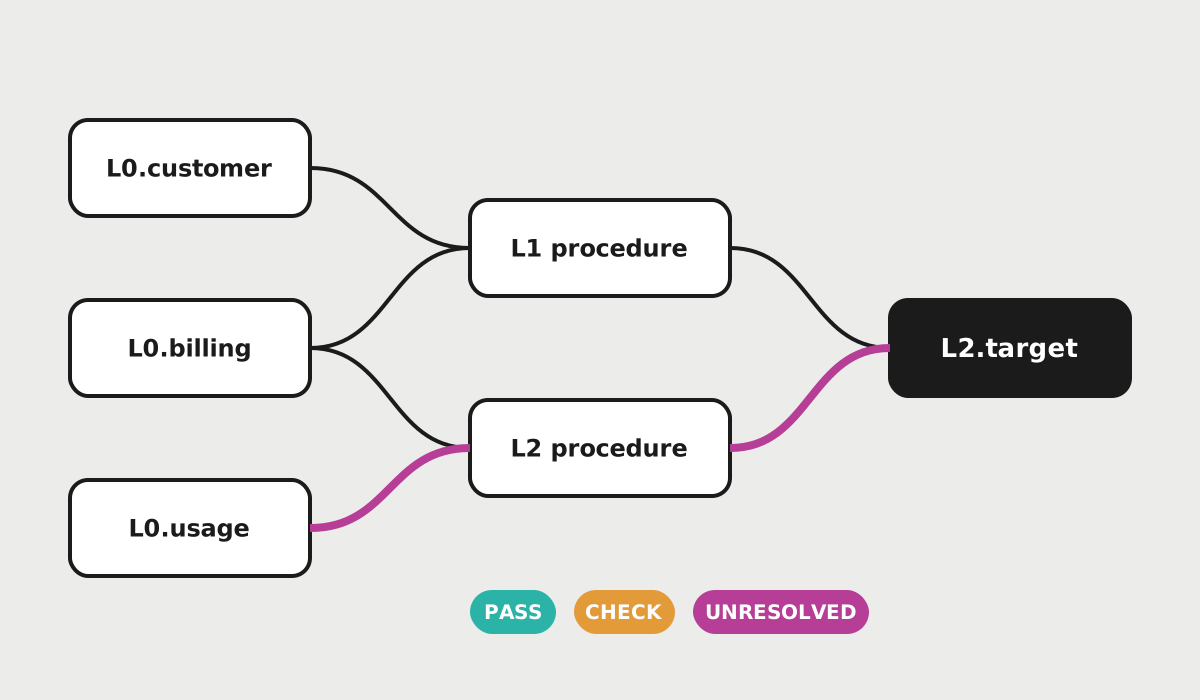
Diagram for Column-Level Lineage For A DB2 To BigQuery Migration
Data engineering

Column-Level Lineage For A DB2 To BigQuery Migration

Written in SQL and JavaScript UDFs, it follows control flow, temp tables, variables and dynamic SQL back to the source columns, then grades each result PASS, CHECK or UNRESOLVED. Static checks catch risky statements before anything runs. Lineage analysis for 300+ stored procedures went from about a month to one or two days.

An LG Uplus project, so the code isn't public.
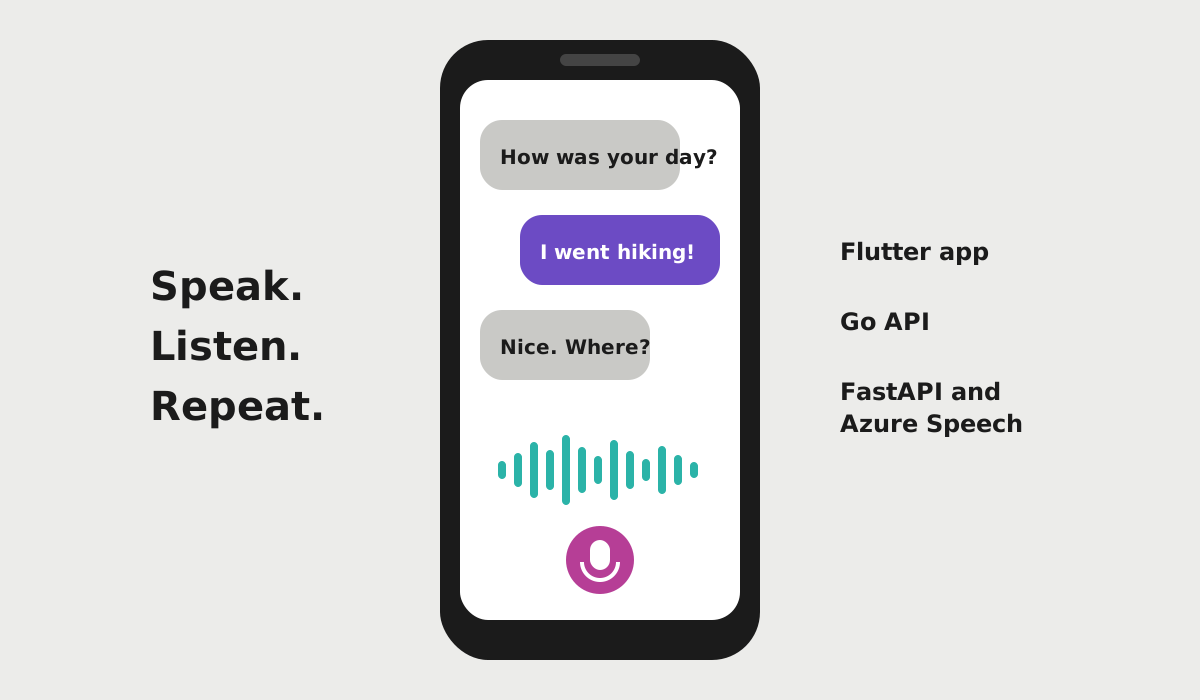
Diagram for Pocket Teacher
Full stack and AI

Pocket Teacher

An app for practicing spoken English, released on iOS and Android. Flutter on the front end, a Go API on PostgreSQL, and a FastAPI service that uses Azure Speech, all running on Azure Container Apps.

Diagram for Change Data Capture Pipeline
Data engineering

Change Data Capture Pipeline

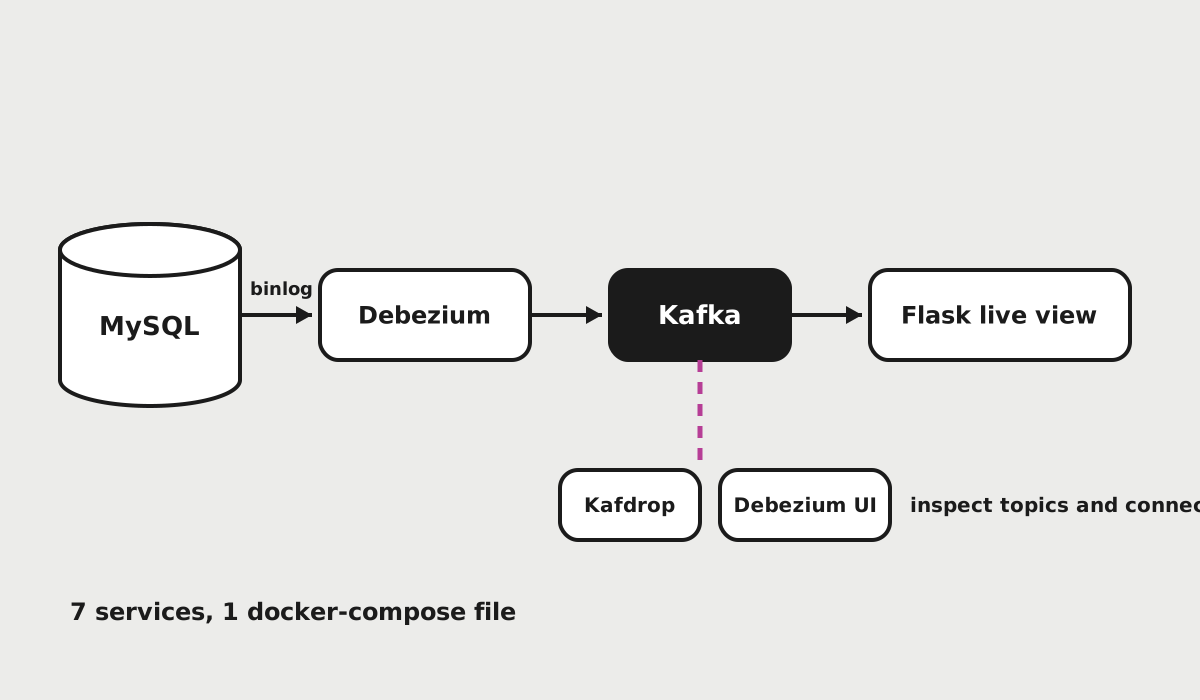
Captures every insert, update and delete from the MySQL binary log with Debezium, publishes it to Kafka, and shows each change in a small Flask app as it happens. Seven services, one Docker Compose file.

Diagram for Funnel And Channel Analytics For Foreign Customers
Data analysis

Funnel And Channel Analytics For Foreign Customers

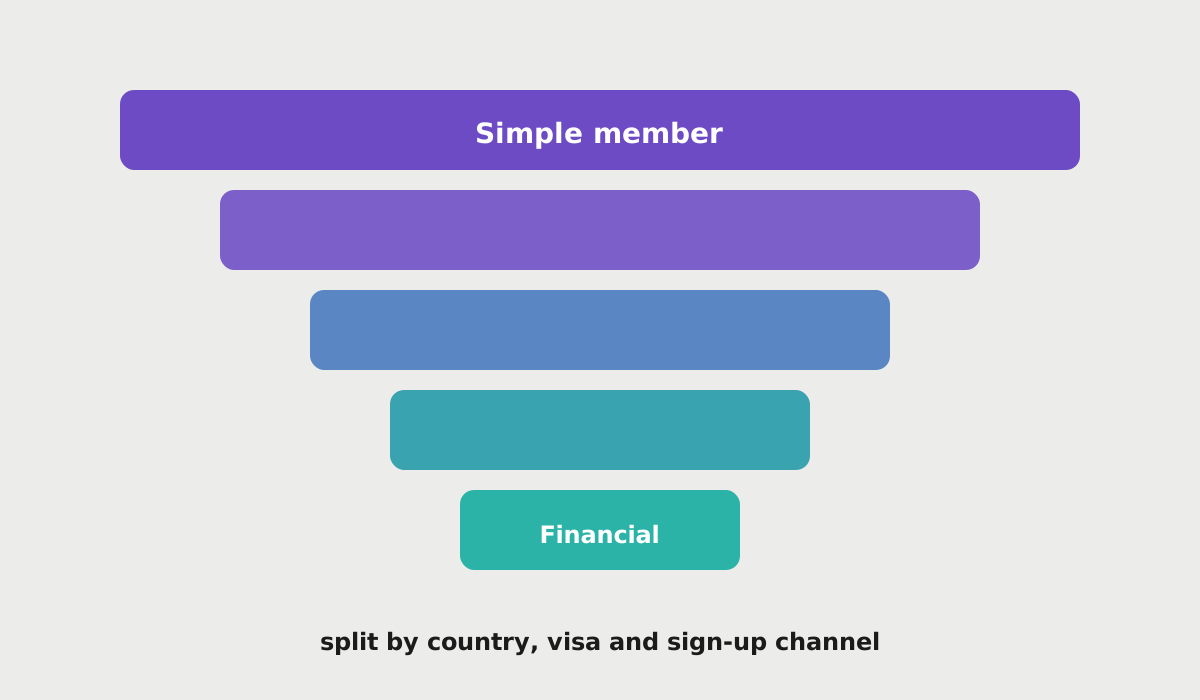
A five-step funnel from simple to financial members, split by country, visa and sign-up channel. Joining Airbridge ad data with internal financial data let marketing rank channels by real conversions instead of traffic, reaching a CTR of 8.5% and a CVR of 3.5% for financial members.

A Jeonbuk Bank project, so the data isn't public.

Diagram for Korean And English RAG
AI

Korean And English RAG

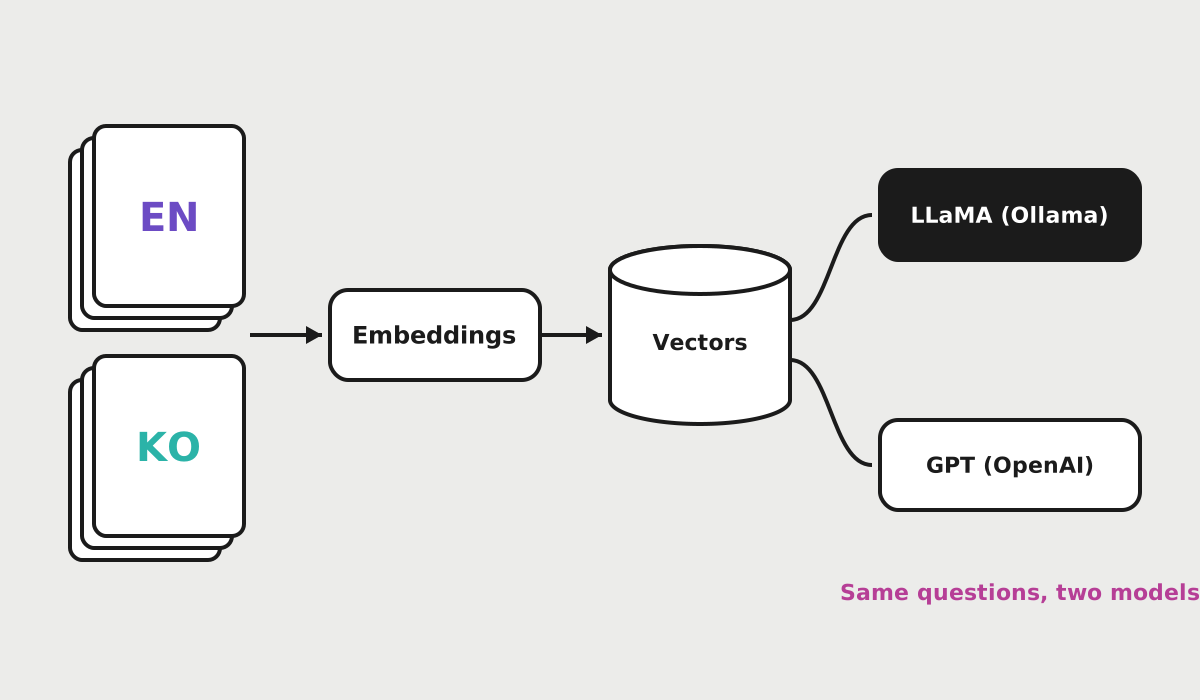
Retrieval-augmented generation over Korean and English documents, tested with LLaMA running locally through Ollama and with GPT through the OpenAI API.

Diagram for Database Comparison Tool
Data engineering

Database Comparison Tool

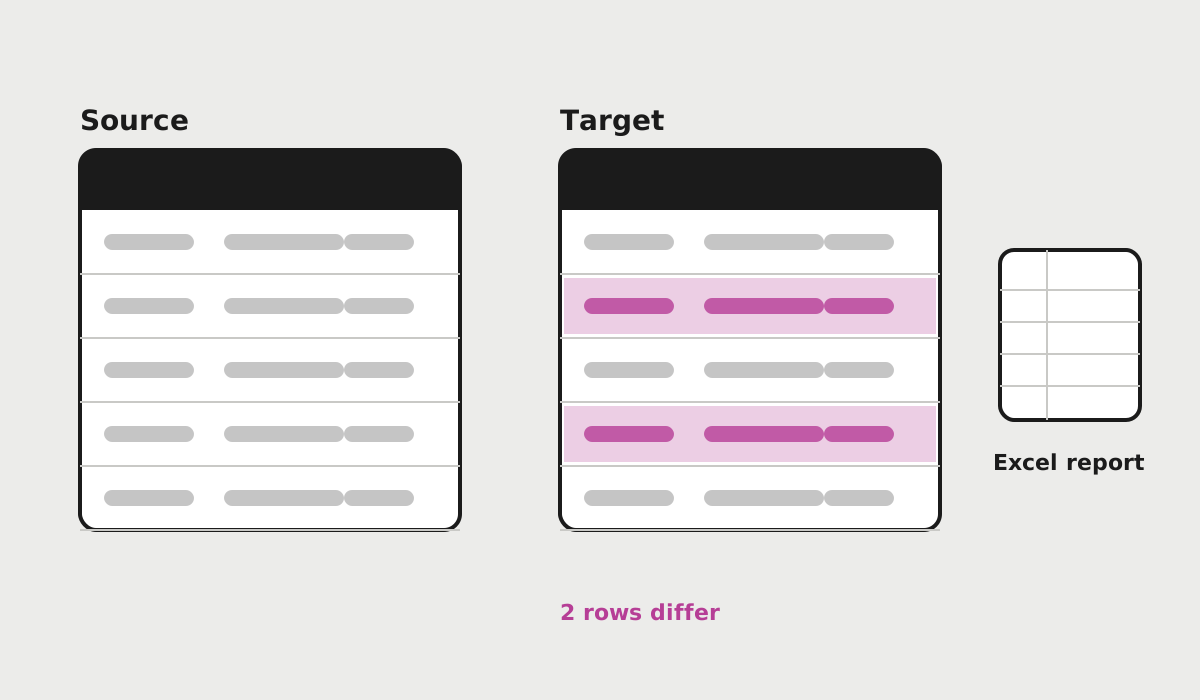
A web tool that compares two MySQL or MariaDB databases for schema, metadata and row-level differences, then exports the report to Excel.